Integration with PlantDemand and Your Company’s Other Data
Many of you have asked about integrating PlantDemand’s Plant Scheduling Software Data with your companies other systems or data. In the new age of cloud data, and more robust tools to bring that data together, we have given you a wonderful gift of a PlantDemand API. While there are many options when it comes to integration, a simple approach is to give you the ability to query your data, and let you configure it in a way that works for you.
Custom reports through a data visualization tool can be created through the following workflow using Microsoft Power BI. Since Power BI sounded like it was the most used tool by our customer base, we are including those instructions first. We may share a step by step method for other tools in the near future such as Tableau, Google Data Studio, etc.
Use the link below to begin, or pass it along to someone on your team who is a power user of Power BI or other data visualization tools. There are code snippets that accompany some of the slides. They can be copied in the sections below.
Step by Step Instruction:
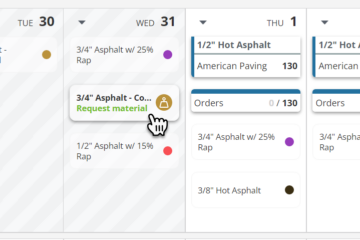
How Scheduling Works
GraphQL Code:
    plantId: orderDates(plantId: 366, dateFrom: "2020-01-01", dateUntil: "2020-12-31") {
    totalCount
    items {
      id
      quantity
      nightshift
      deliveryOn
      loadTime
      order {
        id
        plant {
          name
        }
        customer
        extraFields {
          key
          value
          type
        }
        material {
          name
        }
      }
    }
  }
}
Power BI Advanced Editor Code:
    let
    Source = Json.Document(Web.Contents("https://plantdemand.com/graphql?operationName=null&query=%7B%0A%20%20plantId%3A%20orderDates(plantId%3A%20366%2C%20dateFrom%3A%20%222020-01-01%22%2C%20dateUntil%3A%20%222020-12-31%22)%20%7B%0A%20%20%20%20totalCount%0A%20%20%20%20items%20%7B%0A%20%20%20%20%20%20id%0A%20%20%20%20%20%20quantity%0A%20%20%20%20%0A%20%20%7D%0A%7D%0A&variables=", [Headers=[Authorization="JWT eyJ0eXAiOiJKV1nio_XsMs4zZTx6Ldfs0X42P2ZYLTq5XM", Accept="application/json", Application="JSON"]])),
    #"Converted to Table" = Record.ToTable(Source),
    Value = #"Converted to Table"{0}[Value],
    plantId = Value[plantId],
    items = plantId[items],
    #"Converted to Table1" = Table.FromList(items, Splitter.SplitByNothing(), null, null, ExtraValues.Error),
    #"Renamed Columns" = Table.RenameColumns(#"Converted to Table1",{{"Column1", "Orders"}}),
    #"Expanded Orders" = Table.ExpandRecordColumn(#"Renamed Columns", "Orders", {"id", "quantity", "nightshift", "deliveryOn", "loadTime", "order"}, {"Orders.id", "Orders.quantity", "Orders.nightshift", "Orders.deliveryOn", "Orders.loadTime", "Orders.order"}),
    #"Expanded Orders.order" = Table.ExpandRecordColumn(#"Expanded Orders", "Orders.order", {"id", "plant", "customer", "extraFields", "material"}, {"Orders.order.id", "Orders.order.plant", "Orders.order.customer", "Orders.order.extraFields", "Orders.order.material"}),
    #"Expanded Orders.order.plant" = Table.ExpandRecordColumn(#"Expanded Orders.order", "Orders.order.plant", {"name"}, {"Orders.order.plant.name"}),
    #"Expanded Orders.order.material" = Table.ExpandRecordColumn(#"Expanded Orders.order.plant", "Orders.order.material", {"name"}, {"Orders.order.material.name"}),
    #"Changed Type" = Table.TransformColumnTypes(#"Expanded Orders.order.material",{{"Orders.quantity", Int64.Type}, {"Orders.deliveryOn", type date}})

in
    #"Changed Type"